
Displays

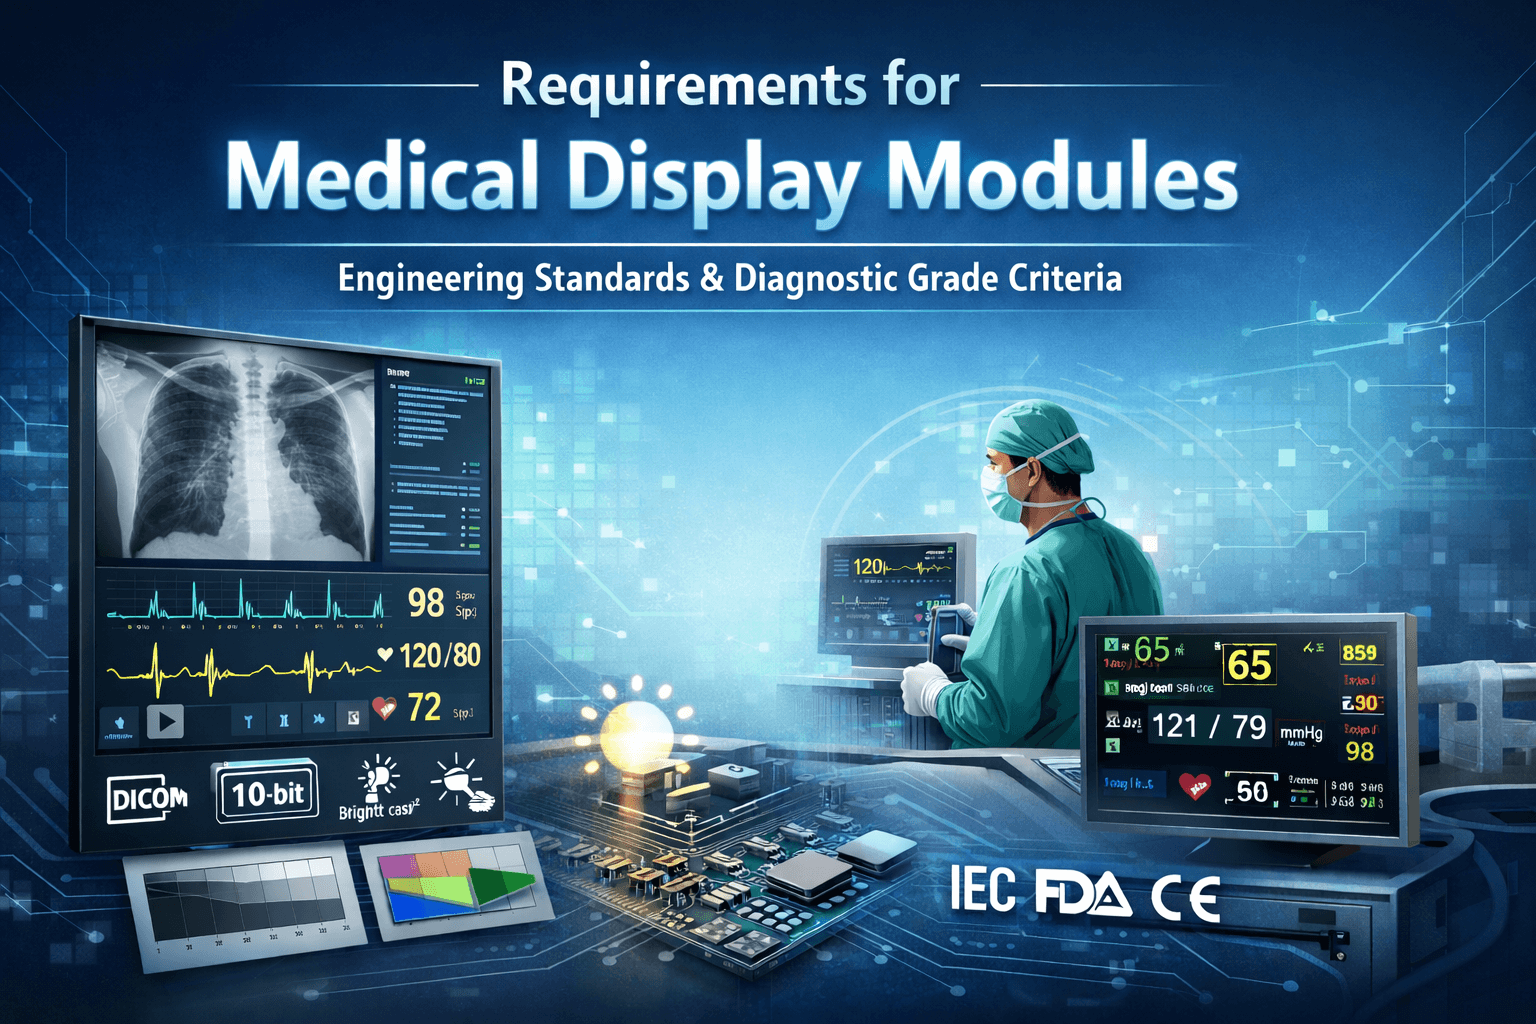
Requirements for Medical Display Modules

Medical displays are not simply “brighter and more expensive monitors”. They are system-level engineering products, covering optics, electronics, grayscale fidelity, long-term stability, and regulatory compliance.

This blog provides a technical, engineering-oriented breakdown, clearly distinguishing:

  • Mandatory requirements
  • Advanced requirements for high-end or diagnostic-grade displays

1. Classification of Medical Displays

Grade Typical Use Cases Stringency
Observation / Clinical Review OR auxiliary displays, patient monitoring, endoscopy, PACU, bedside viewing ★★★☆☆
Clinical (General Clinical Use) Routine clinical image review, department workstations ★★★★☆
Diagnostic Radiology, mammography, pathology, image-based diagnosis ★★★★★

Important:
Most products marketed as “medical displays” only meet observation-grade requirements.
True diagnostic-grade displays are far more demanding, with a significant cost gap.


2. Optical & Display Core Requirements (Most Critical)

2.1 Resolution & Size Matching (Mandatory)

Principle:

  • Image pixel resolution should match the native panel resolution
  • Strong interpolation or upscaling that affects diagnostic fidelity is unacceptable


2.2 Luminance (Brightness) (Mandatory / Stricter for Diagnostic)

Grade Typical Peak Luminance
Observation ≥ 300 cd/m²
Clinical ≥ 400 cd/m²
Diagnostic ≥ 1000 cd/m² (Mammography ≥ 2000 cd/m²)

Requirements:

  • Long-term luminance decay ≤ 10–15%
  • Stable operation under continuous use

Common Techniques:

  • LED constant-current backlight driving
  • Integrated luminance sensor (for closed-loop control)


2.3 Contrast Ratio & Black Level (Mandatory)

Typical Targets:

  • Observation / Clinical: ≥ 1000:1
  • Diagnostic: ≥ 1500–2000:1

Black level must be minimized, especially for lung and soft-tissue visualization.


2.4 Grayscale Performance & DICOM GSDF (Mandatory for Diagnostic)

This is one of the fundamental differentiators of medical displays.

  • Diagnostic displays must comply with DICOM Part 14 (GSDF)
  • Displays without DICOM GSDF compliance cannot legally be marketed as diagnostic displays

Technical Requirements:

  • True 10-bit grayscale (1024 levels)
  • Diagnostic-grade commonly uses 12-bit LUT + 10-bit panel
  • Long-term grayscale consistency without drift
  • Support for automatic or semi-automatic DICOM calibration


2.5 Color Performance (Application-Dependent)

Application Color Requirement
Ultrasound / Monitoring sRGB, 8-bit sufficient
Endoscopy / Surgery High color gamut & color accuracy
Pathology High color accuracy, ΔE ≤ 2

High-end configurations:

  • Adobe RGB ≥ 90%
  • True 10-bit color depth
  • Long-term color stability


3. Stability & Reliability (Critical for Medical Use)

3.1 Long-Term Stability & Aging (Mandatory / Diagnostic Critical)

  • 24/7 continuous operation
  • Aging tests ≥ 10,000–50,000 hours
  • Controlled drift in luminance, grayscale, and color


3.2 Luminance Uniformity (Mandatory / Diagnostic Critical)

Grade Uniformity Target
Clinical ≥ 80–85%
Diagnostic ≥ 90–95%

Typical Techniques:

  • Panel-level zone compensation
  • Factory uniformity correction LUTs


3.3 Viewing Angle Consistency (Mandatory)

  • IPS or equivalent wide-view technology
  • No grayscale distortion with viewing angle changes (critical for diagnosis)


4. Hardware & Mechanical Design (Often Underestimated)

4.1 Electrical Interface (Mandatory)

Common Interfaces:

  • DisplayPort (preferred)
  • DVI (legacy systems)
  • HDMI (not preferred for medical-critical use)

Requirements:

  • Stable high-resolution output
  • EMI robustness for medical environments


4.2 Surface, Housing & Medical Environment Compatibility (Mandatory)

  • Easy to clean
  • Resistant to disinfectants

Optional Enhancements:

  • Liquid ingress protection (IPx1 / IPx2)
  • White or medical-gray surfaces to reduce reflections


4.3 Power System Reliability (Mandatory)

  • Medical-grade power design
  • Strong EMI / ESD immunity
  • Strict leakage current control


5. Software & Quality Control (Invisible Core)

QA / QC System (Mandatory for Diagnostic)

  • Individual factory calibration report per unit
  • Per-unit LUT calibration
  • Full serial-number traceability


6. Regulatory & Compliance (Critical)

Category Standard
Electrical Safety IEC 60601-1
EMC IEC 60601-1-2
Medical Software IEC 62304
China NMPA (formerly CFDA)
USA FDA (Class I / II)
EU CE / MDR

DICOM Compliance Declaration (Diagnostic Mandatory):

  • Explicit statement of DICOM Part 14 support
  • Test and validation documentation


7. Engineering Summary

Observation-Grade Medical Displays (Most Common)

  • IEC 60601 compliant
  • Stable luminance & reliability
  • DICOM GSDF not mandatory

True Diagnostic Medical Displays

  • Full DICOM GSDF pipeline
  • Stable grayscale & uniformity
  • 12-bit LUT + luminance sensor
  • Calibration & QA systems
  • Cost typically 3–10× consumer displays


8. Observation-Grade Medical Display Module Requirements

(LCD Module Level)

Observation-grade ≈ clinical review, monitoring, surgical viewing
Not used for final diagnosis
Requirements are relaxed compared to diagnostic grade, but still governed by IEC 62563-1


8.1 Optical Performance (Panel-Level)

Resolution & Pixel Density

  • Common: FHD (1920×1080), 1920×1200, 2560×1440
  • Recommended pixel pitch ≤ 0.27 mm

Grayscale

  • Minimum 8-bit
  • Preferred: 8-bit + FRC (~10-bit equivalent)


8.2 Luminance / Contrast / Uniformity

  • Typical peak luminance: 350–400 cd/m²
  • Calibrated working luminance: ≥ 250–300 cd/m²
  • Contrast ratio: ≥ 1000:1
  • Black level: ≤ 0.3 cd/m² (at working luminance)
  • Uniformity: ≥ 80–90% (min/center)


8.3 Panel Technology & Viewing Angle

  • IPS / ADS preferred
  • Viewing angle ≥ 178° / 178°
  • TN panels are not acceptable


8.4 Grayscale Linearity & Gamma

  • Stable Gamma 2.2 default
  • Smooth grayscale transitions, no banding
  • Reserve headroom for future DICOM calibration


8.5 Color Performance (Color-Critical Observation)

  • ≥ 100% sRGB
  • Optional: ≥ 95% DCI-P3
  • ΔE_avg < 2–3 after calibration
  • White point: D65 (≈ 6500K)


8.6 Stability & Aging

  • Backlight constant-current control
  • Temperature compensation
  • Target lifetime: 30k–50k hours
  • Reserved positions for luminance / temperature sensors


8.7 Electrical & Interface

  • eDP 1.2+ or dual-channel LVDS
  • 8/10-bit support
  • ≥ 60 Hz refresh (video/endoscopy: 75–120 Hz recommended)
  • PWM + DC dimming with flicker control
  • Wide dimming range (1–10% to 100%)


8.8 Mechanical & Environmental Design

  • Support optical bonding
  • AG / AR / AF surface treatment
  • Alcohol & disinfectant resistance
  • Thermal design suitable for 7×24 operation


9. Typical Applications (Observation-Grade)

9.1 Life-Support & Therapy Devices (Bedside / OR)

These are classic observation-grade displays: continuous viewing, safety-critical, but not image-diagnostic.

Respiratory & Critical Care

  • Ventilators
    • ICU ventilators
    • Transport ventilators
    • Anesthesia ventilators
    • Neonatal ventilators
  • Resuscitators
    • Manual & automated resuscitation systems
  • CPAP / BiPAP devices (clinical versions)
  • Oxygen concentrators (hospital-grade)

Display role:
Waveforms, numeric parameters, alarms, trends


9.2 Infusion & Drug Delivery Systems

All are observation-grade, even though they are safety-critical.

Pumps

  • Infusion Pumps
    • Volumetric infusion pumps
    • Smart infusion pumps
  • Syringe Pumps
  • PCA Pumps (Patient-Controlled Analgesia)
  • Insulin infusion systems (hospital use)
  • Enteral feeding pumps

Display role:
Dosage, flow rate, volume, time remaining, alarms


9.3 Patient Monitoring Devices

Vital-Signs Monitoring

  • ECG Monitors
  • Multi-parameter Monitors
    • ECG
    • SpO₂
    • NIBP / IBP
    • Respiration
    • Temperature
  • Bedside monitors
  • Central monitoring stations (viewing-only screens)

Neuro / Physiological Monitoring

  • EEG monitors (routine monitoring)
  • EMG monitors
  • Sleep monitoring systems

Borderline:
EEG used for research or clinical monitoring → Observation
EEG used for formal neurological diagnosis → Diagnostic-adjacent


9.4 Imaging Devices (Viewing, Not Diagnosis)

These are very common sources of confusion.

Ultrasound

  • Ultrasound systems (real-time viewing)
  • Portable ultrasound
  • POCUS (Point-of-Care Ultrasound)

Diagnostic decisions are often made with ultrasound,
but the display itself is usually observation-grade, not DICOM-calibrated.

9.5 Endoscopy & Surgical Visualization

Endoscopic Systems

  • Gastroscopes
  • Colonoscopes
  • Bronchoscopes
  • Laparoscopes
  • Arthroscopes
  • Ureteroscopes

Surgical Displays

  • OR surgical monitors
  • Surgeon-side displays
  • Assistant displays

Display role:
Real-time color video, motion clarity, low latency

Key point:
These are never diagnostic-grade displays, even though surgeons make decisions while viewing them.


9.6 Emergency & Acute Care Equipment

  • Defibrillators
    • AEDs
    • Manual defibrillators
  • Patient transport monitors
  • Ambulance monitors
  • Portable emergency monitors


9.7 Laboratory & Clinical Instruments

Analytical Devices

  • Blood glucose meters
  • Alcometers (breath alcohol testers)
  • Blood gas analyzers
  • Coagulation analyzers
  • Immunoassay analyzers

Lab Equipment

  • Centrifuges
  • Incubators
  • Blood cell counters
  • Urine analyzers

Display role:
Results display, status, workflow, alarms


9.8 Renal & Long-Term Therapy Devices

  • Dialysis machines
    • Hemodialysis
    • Peritoneal dialysis
  • CRRT systems


9.9 Medical IT & Workflow Displays

  • Digital medical records terminals
  • Nurse station displays
  • Clinical workflow panels
  • Medication administration record (MAR) terminals
  • Bedside information displays
  • Patient-facing displays (education/status)


9.10 Rehabilitation & Assistive Devices

  • Physiotherapy equipment
  • Rehabilitation robots
  • Gait analysis systems
  • Patient feedback terminals


9.11 Portable & Home-Care Medical Devices (Clinical Grade, Not Consumer)

  • Hospital-grade portable monitors
  • Home dialysis systems (clinical versions)
  • Remote patient monitoring hubs
  • Telemedicine carts (display side)


Summary Table (Quick Reference)

Category Observation-Grade? Notes
Ventilators Yes Safety-critical, non-diagnostic
Infusion / Syringe / PCA pumps Yes Numeric + alarm displays
ECG / Multi-parameter monitors Yes Diagnostic logic elsewhere
EEG (routine monitoring) Yes Diagnostic only if formal neuro
Ultrasound displays Yes Typically not DICOM
Endoscopy / Surgical displays Yes Video accuracy > grayscale
Defibrillators Yes Numeric + waveform
Dialysis machines Yes Continuous monitoring
Blood glucose meters Yes Result display
Lab analyzers Yes Data review only
EMR / Nurse station displays Yes Workflow viewing


10. Common Display sizes for Observation-Grade Medical Applications

Application → Optimal Panel Size (Small → Large)

Medical Application Typical Viewing Distance Info Density Recommended Panel Size(s) Why This Size Is Optimal
Blood Glucose Meter Handheld (30–40 cm) Low 3.5″ Numeric + simple graphs; handheld ergonomics dominate
Alcometer (Breath Alcohol Tester) Handheld Very Low 3.5″ Digits, icons, pass/fail status only
Portable Pulse Oximeter Handheld Low 3.5″ → 4.3″ SpO₂, pulse waveform; 4.3″ improves readability
Syringe Pump Bedside (0.5–1 m) Low–Medium 4.3″ → 5″ Flow rate + alarms; must be readable at angle
PCA Pump Bedside Medium 4.3″ → 5″ Adds patient status + lockout info
Infusion Pump Bedside Medium 5″ Multiple parameters + trend visibility
Portable ECG Monitor Bedside / Transport Medium 5″ → 7″ Waveform clarity becomes important
Patient Monitor (Basic) Bedside Medium 7″ Multi-wave + numeric panels
Ventilator Bedside Medium–High 7″ → 10.1″ Loops, waveforms, settings simultaneously
Resuscitator / Emergency Ventilation Unit Mobile / Emergency Medium 7″ Quick recognition, gloves, harsh lighting
Defibrillator (Manual / AED) Emergency Medium 7″ ECG waveform + prompts + alarms
Multi-Parameter Monitor ICU / OR High 10.1″ → 12.1″ ECG, SpO₂, BP, CO₂, trends
EEG Monitor (Bedside) Clinical workstation High 10.1″ → 12.1″ Dense waveforms; longer observation
Centrifuge Control Panel Equipment front panel Medium 5″ → 7″ Parameters + program selection
Ultrasound (Portable) Near-field viewing High 10.1″ Image interpretation needs area
Ultrasound (Cart-based) Workstation Very High 12.1″ → 15.6″ Imaging clarity over portability
Endoscopy Processor (Gastroscope) OR cart High 10.1″ → 15.6″ Color accuracy + detail
Dialysis Machine Bedside Medium–High 10.1″ Treatment duration + trends
Digital Medical Records Terminal Nurse station Medium 10.1″ → 15.6″ Readability + touch usability


Key Engineering Patterns

10.1 Small Control Devices → 3.5″ / 4.3″

Common traits

  • Handheld or single-hand operation
  • Numeric-dominant UI
  • BOM-sensitive
  • Battery powered

Typical platform

  • 3.5″ or 4.3″ TFT
  • 480×272 or 800×480
  • RGB or LVDS
  • 400–600 nits


10.2 Bedside Therapy Devices → 5″ / 7″

Common traits

  • Must be readable from 0.5–1 m
  • Waveforms + numeric overlays
  • Gloved operation
  • Continuous 24/7 use

Typical platform

  • 5″ or 7″ TFT
  • 800×480 / 1024×600 / 1280×800
  • IPS, wide angle
  • High contrast + stable backlight


10.3 Monitoring & Imaging Consoles → 10.1″+

Common traits

  • Multi-parameter visualization
  • Trend charts + waveforms
  • Longer viewing sessions
  • Less BOM pressure, more reliability pressure

Typical platform

  • 10.1″ / 12.1″ TFT
  • 1280×800 / 1920×1080
  • Optical bonding
  • Tight uniformity & color stability

Platform-Unification View (What You Can Reuse)

Platform Size Can Serve Applications
3.5″ Glucose, alcohol, small handheld monitors
4.3″ Syringe pumps, PCA pumps, portable oximeters
5″ Infusion pumps, transport ECG
7″ Ventilators, defibrillators, bedside monitors
10.1″ ICU monitors, dialysis, ultrasound, endoscopy
  • A 5-SKU panel strategy can realistically cover 90% of observation-grade devices


11. System-level, engineering-oriented mapping

11.1 Full list of Observation-Grade Medical Applications (practical scope)

Observation-grade = not for final diagnosis, but for monitoring, control, visualization, workflow, and guidance.

Life-support & Therapy Devices

  • Ventilators / Respirators
  • Anesthesia machines
  • Dialysis machines
  • Oxygen concentrators
  • Resuscitators
  • Defibrillators

Infusion & Drug Delivery

  • Infusion pumps
  • Syringe pumps
  • PCA pumps (patient-controlled analgesia)
  • Enteral feeding pumps

Monitoring & Vital Signs

  • ECG monitors
  • EEG monitors
  • Multi-parameter monitors (ECG + SpO₂ + NIBP + Temp)
  • Fetal monitors
  • Bedside monitors
  • Transport monitors

Imaging (non-diagnostic display role)

  • Ultrasound front panels
  • Ultrasound secondary displays
  • Endoscopy systems (gastroscope, colonoscope)
  • Surgical camera systems
  • C-arm auxiliary displays

Laboratory & Point-of-Care

  • Blood glucose meters
  • Blood gas analyzers
  • Alcometers
  • Centrifuges
  • Hematology analyzers
  • Immunoassay analyzers

Emergency & Transport

  • Ambulance monitors
  • Portable ultrasound
  • Portable ventilators
  • Emergency carts

Clinical IT & Workflow

  • EMR terminals
  • Nurse station displays
  • Bedside information terminals
  • Medical tablets / HMIs


11.2 Mapping Table: Application → Optimal Panel Size (Small → Large)

Rule of thumb

  • Data-centric → small
  • Waveform-centric → medium
  • Image-centric → large
Application Optimal Size Acceptable Range Rationale
Blood glucose meter 3.5″ 3.2–4.3″ Numeric-dominant, battery device
Alcometer 3.5″ 3.2–4.3″ Simple UI, handheld
Syringe pump 3.5″ 3.5–4.3″ Rate + volume + alerts
PCA pump 3.5″ 3.5–4.3″ Button-driven UI
Infusion pump 4.3″ 4.3–5″ Better trend & alarms
Ventilator (compact) 5″ 4.3–7″ Waveforms + loops
Ventilator (ICU) 7″ 7–10.1″ Multiple waveforms
ECG monitor (basic) 5″ 5–7″ ECG + vitals
Multi-parameter monitor 7″ 7–10.1″ ECG + SpO₂ + NIBP
Transport monitor 5″ 4.3–7″ Power-limited
EEG monitor (bedside) 7″ 7–10.1″ Multi-channel waves
Endoscopy control unit 10.1″ 7–12.1″ Image + menu
Ultrasound (secondary) 10.1″ 10.1–12.1″ Image-centric
Dialysis machine 10.1″ 7–12.1″ Process visualization
Defibrillator 5″ 4.3–7″ ECG + prompts
EMR bedside terminal 10.1″ 10.1–15.6″ Text + UI


11.3 Mapping: Application → SoC / Interface / Power Profile

This is where platform reuse becomes clear.

Small Panel Platform (3.5″–4.3″)

Typical Applications

  • Syringe pump
  • PCA pump
  • Glucose meter
  • Alcometer

SoC

  • STM32F4 / F7 / H7
  • NXP i.MX RT
  • GD32 / Renesas RA
  • No GPU required

Interface

  • RGB 16/18/24-bit
  • MCU-driven TFT
  • SPI + RGB hybrid

Power Profile

  • Backlight: 1–2 W
  • Total display module: < 3 W
  • Battery-friendly

Display Characteristics

  • 400–600 nits
  • 800:1–1000:1
  • 8-bit or 8-bit+FRC
  • PWM + DC dimming mandatory


Medium Panel Platform (5″–7″)

Typical Applications

  • Ventilators
  • ECG monitors
  • Infusion pumps
  • Defibrillators
  • Transport monitors

SoC

  • NXP i.MX6ULL / i.MX7
  • Allwinner T113 / V3
  • Rockchip RK3308
  • Sitara AM335x

Interface

  • RGB (low end)
  • LVDS (most common)
  • Single-lane eDP (emerging)

Power Profile

  • Backlight: 3–6 W
  • Module total: 4–8 W

Display Characteristics

  • ≥500 nits
  • IPS mandatory
  • 60–75 Hz
  • Optical bonding highly recommended


Large Panel Platform (10.1″–12.1″)

Typical Applications

  • Dialysis
  • Ultrasound UI
  • Endoscopy processors
  • Multi-parameter ICU monitors

SoC

  • NXP i.MX8M / i.MX8MP
  • Rockchip RK3566 / RK3568
  • TI AM62 / AM64
  • Qualcomm QCS (high-end)

Interface

  • eDP (preferred)
  • Dual-channel LVDS (legacy)
  • MIPI-DSI (tablet-like designs)

Power Profile

  • Backlight: 6–12 W
  • Module total: 8–15 W

Display Characteristics

  • 500–800 nits
  • Better uniformity
  • Optional touch (PCAP)
  • Strong EMI design required


11.4  Extracted Common Denominators → One Platform Module Strategy

 What all observation-grade devices share

Dimension Common Requirement
Display type IPS / ADS only
Brightness ≥400 nits
Operation 24/7 capable
EMI IEC 60601-1-2 ready
Backlight DC + PWM dimming
Temperature −10 to +60 °C panel-safe
Lifetime ≥30k–50k hours
Cleaning Alcohol-resistant front


Recommended Platform Family

Platform Size Interface Target Devices
Platform-S 3.5″/4.3″ RGB Pumps, meters
Platform-M 5″/7″ LVDS Ventilator, ECG
Platform-L 10.1″ eDP Dialysis, ultrasound

Each platform:

  • Same backlight driver architecture
  • Same optical bonding strategy
  • Same reliability qualification flow
  • Different glass & resolution only

11.5 MCU, low end MPU, MPU and Soc Explained

MCU (Microcontroller Unit)

  • Single-chip control brain
  • CPU + Flash + SRAM + peripherals on one die
  • Typically no external DRAM
  • Runs bare-metal or RTOS (FreeRTOS, Zephyr)

Key characteristics

Aspect MCU
OS Bare-metal / RTOS
External DRAM ❌ No
MMU ❌ No
Clock ~50–300 MHz
Power Very low
Cost Very low
Boot time Instant

Display capability

  • Small displays only
  • RGB, SPI, 8080 interface
  • Simple UI (numbers, icons, basic waveforms)

Examples

STMicroelectronics

  • STM32F4 / F7 / H7
    (H7 can do small LCD + simple graphics)

NXP

  • LPC55xx
  • i.MX RT1060 / RT1170 (MCU but very fast)

Microchip

  • SAM E70

Medical use cases

✔ Syringe pumps
✔ PCA pumps
✔ Simple infusion pumps
✔ Blood glucose meters
✔ Small ECG transport monitors

Rule of thumb:

If UI is simple, deterministic, and safety-critical → MCU wins

Low-End MPU (Entry-Level Application Processor)

This category sits between MCU and full MPU

  • Application processor without GPU
  • External DDR memory
  • Often no MMU or very limited graphics acceleration
  • Can run Embedded Linux or RTOS

Key characteristics

Aspect Low-end MPU
OS RTOS / Embedded Linux
External DRAM  Yes
MMU  Limited
GPU  No
Clock ~400–800 MHz
Power Low–medium
Cost Low

Display capability

  • 4.3″–7″ LCD
  • RGB / LVDS / MIPI-DSI
  • Moderate UI complexity

Examples

NXP

  • i.MX6ULL
  • i.MX7ULP

Microchip

  • SAMA5D27

Allwinner

  • F1C200s / V3s (very common in Chinese pumps)

Medical use cases

✔ Infusion pumps (color UI)
✔ Compact ECG monitors
✔ Dialysis machine UI
✔ Portable patient monitors

Rule of thumb:

If you need Linux UI + moderate graphics, but no video → low-end MPU


MPU (Application Processor)

  • Full application processor
  • External DDR
  • MMU + often basic GPU
  • Runs Linux

Key characteristics

Aspect MPU
OS Embedded Linux
External DRAM  Yes
MMU  Yes
GPU  Basic
Clock ~1–1.5 GHz
Power Medium
Cost Medium

Display capability

  • 7″–10.1″
  • LVDS / MIPI-DSI / eDP
  • Waveforms + video + rich UI

Examples

NXP

  • i.MX6 Solo / DualLite
  • i.MX8M Mini

Rockchip

  • RK3288
  • RK3566

Allwinner

  • A64 / A133

Medical use cases

✔ Ventilators
✔ Multi-parameter monitors
✔ Bedside ECG monitors
✔ Endoscopy processor UI

Rule of thumb:

If you need waveforms + animations + Linux UI, choose MPU


SoC (System-on-Chip)

Technically everything above is a SoC,
but in industry people say “SoC” to mean high-integration + GPU/video

  • MPU plus GPU + video codec + AI accelerators
  • Multiple display pipelines
  • Multimedia-grade

Key characteristics

Aspect SoC
OS Linux / Android
External DRAM  Yes
GPU  Strong
Video  Encode/decode
Clock 1–2+ GHz
Power Medium–high
Cost Higher

Display capability

  • 10.1″+
  • Multiple displays
  • High-FPS waveforms, video, camera input

Examples

NXP

  • i.MX8M Plus (GPU + ISP)

Rockchip

  • RK3588

Qualcomm

  • QCS610 / QCS6490

Medical use cases

✔ Ultrasound
✔ Advanced endoscopy
✔ Imaging carts
✔ AI-assisted monitors

Rule of thumb:

If you need video, camera, AI, multi-display → SoC


Quick Comparison Table

Category MCU Low-end MPU MPU SoC
External DDR No Yes Yes Yes
Linux No Basic Yes Yes
GPU No No Basic Yes
Typical display ≤4.3″ 4.3–7″ 7–10.1″ 10.1″+
UI complexity Low Medium High Very high
Power Very low Low Medium Medium–High
Cost $ $$ $$$ $$$$

Medical Display-Centric Recommendation

Observation-grade medical display platform sweet spot

Device Best choice
Syringe / PCA pump MCU
Infusion pump MCU → low-end MPU
ECG transport Low-end MPU
ECG bedside MPU
Ventilator MPU
Multi-parameter monitor MPU
Ultrasound / endoscopy SoC

One-line takeaway

MCU = control
Low-end MPU = simple Linux UI
MPU = waveform-heavy medical UI
SoC = video / imaging / AI


Should you have any questions, please consult our engineering.

Displays

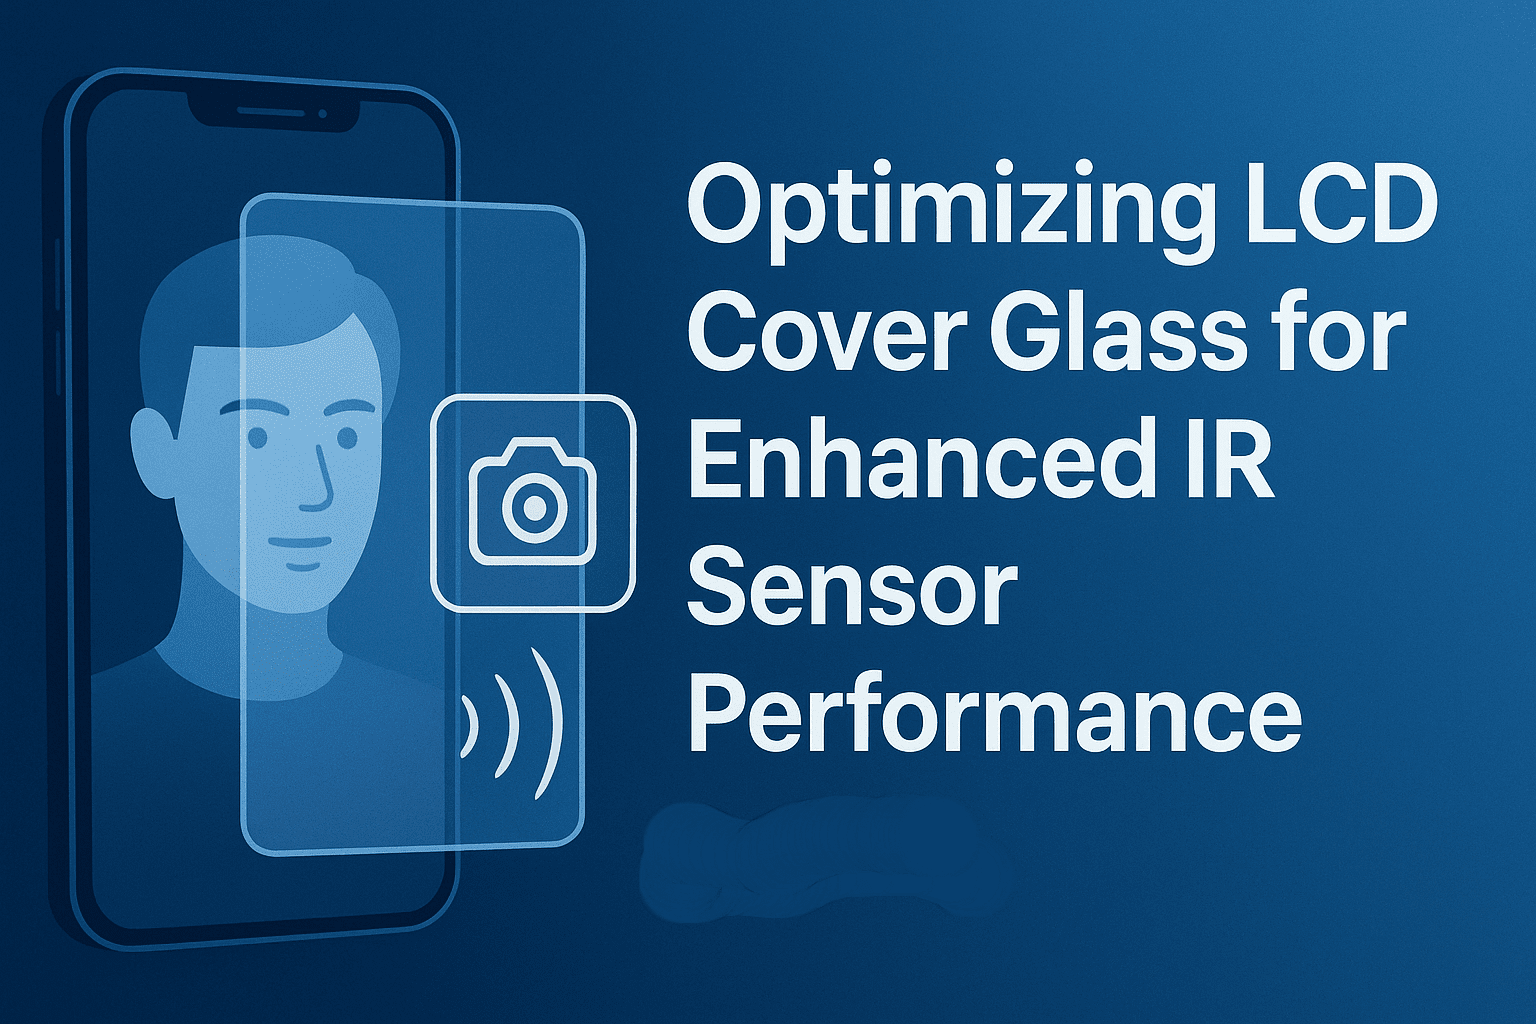
Optimizing LCD Cover Glass for Enhanced IR Sensor Performance

When designing applications that rely on infrared technology—be it a sleek smartphone with facial recognition or a responsive optical touch interface—a critical challenge often arises: the cover glass, meant to protect the display, can significantly attenuate the IR signal.

Orient Display FAE team is here to help!   This essay offers a clear comparison of glass types and thicknesses to guide you in selecting a solution that maximizes transmittance and ensures end-user reliability.

What is Light Transmittance of LCD Glass Cover?

Light transmittance refers to the percentage of incident light that can pass through the glass cover of a display. It is expressed in percentage (%).
Example: A transmittance of 85% means 85% of the incoming light can pass through the glass.

Factors Affecting LCD Cover Glass Transmittance

Factor Description & Impact
Glass Type The material composition is fundamental. Soda-lime glass, Ultra-clear glass (low-iron), and Aluminosilicate glass (e.g., Gorilla Glass) have different inherent transmittance. Low-iron glass typically offers higher transmittance.
Thickness Thicker glass leads to greater light absorption and scattering. Thinner glass generally provides higher transmittance. For example, transmittance may increase from ~81% at 2.9 mm to ~87% at 2.0 mm for Soda-lime glass.
Surface Coating Coatings like Anti-Glare (AG), Anti-Reflection (AR), and Anti-Fingerprint (AF) alter how light interacts with the surface. While AG may reduce it, AR coating is specifically designed to increase transmittance by reducing surface reflection.
Polarizer Attachment Adding a polarizer changes the light’s polarization state and typically reduces overall transmittance significantly. Special “high-brightness” polarizers can recover a small amount (~1.3-1.5%).
Boarder Silk Screen Printing Black ink printing on the borders is opaque and blocks all light. This does not affect the material’s intrinsic transmittance but reduces the effective viewable area for light transmission.


Why 940 nm Is Important in LCD Applications

While visible-light transmittance affects display brightness and clarity, the transmittance at infrared wavelengths—especially around 940 nm.

940 nm refers to the wavelength of infrared light, the transmittance of cover glass at 940 nm is critical for ensuring accurate sensor performance, Infrared light (IR) at 940 nm is widely used in proximity sensors, facial recognition, optical touch, and remote-control systems because it is safe, energy-efficient, and undetectable to the human eyes.


Many modern electronic devices integrate sensors that rely on infrared light. These components are often located behind the cover glass of displays or touch panels.

Application Usage of 940 nm IR
Smartphone face recognition IR illumination and depth sensing
Proximity & gesture sensors IR reflection and detection
IR touch and in-display fingerprint Optical transmission through cover glass
Remote controls / IR communication 940 nm IR LED
TOF (Time-of-Flight) sensors Distance and depth mapping

For these functions to work properly, the cover glass must allow sufficient infrared light to pass through. In many specifications, a minimum IR transmittance (such as ≥80% at 940 nm) is required.


Glass Material Effect

Different glass types have different absorption characteristics for near-infrared light.

Glass Type Transmittance at 940 nm
Standard soda-lime glass ~75–82%
Low-iron ultra-clear glass ~85–90%
Gorilla/ Dragontrail or aluminosilicate glass ~88–92%


Infrared Transmittance at 940 nm — by Glass Type & Thickness

Standard Soda-Lime Glass

Thickness Typical IR Transmittance at 940 nm
3.0 mm 74% – 78%
2.9 mm 79% – 81%
2.5 mm 80% – 82%
2.0 mm 83% – 87%
1.1 mm 85% – 87%
0.7 mm 86% – 88%


Low-Iron Ultra-Clear Glass

Thickness (mm) Typical IR Transmittance at 940 nm (%)
3.0 mm 84% – 87%
2.9 mm 85% – 87.5%
2.5 mm 87% – 89%
2.0 mm 89% – 91%
1.1 mm 91% – 93%
0.7 mm 92% – 94%

* Low iron reduces absorption and improves clarity, especially helpful for both visible and infrared wavelengths.

Aluminosilicate / Gorilla Glass/ Dragontrail

Thickness (mm) Typical IR Transmittance at 940 nm (%)
2.9 mm 88% – 90%
2.0 mm 90% – 92%
1.5 mm 91% – 93%
1.1 mm 92% – 94%
0.7 mm 93% – 95%


Chemically strengthened aluminosilicate glass has the best infrared transmittance, making it ideal for cover glass over sensors, cameras, and biometric modules.


Comparison Summary

Glass Type IR Performance Strength Cost Typical Usage
Standard Soda-Lime Low Low Basic cover glass, low-cost devices
Low-Iron Ultra-Clear Medium Medium ★★ Displays, automotive, touch cover
Aluminosilicate High High (chem-strengthened) ★★★ Premium cover glass, sensor window, face/fingerprint ID


Application Guidance

Use Case Recommended Glass
Standard display cover Standard soda-lime or low-iron glass
High-brightness display Low-iron ultra-clear glass
Optical/fingerprint touch Low-iron or aluminosilicate glass
Face ID / IR sensing / camera Aluminosilicate (thin, high IR transmission)
Automotive HUD / display Low-iron or aluminosilicate


Surface Coating Influence infrared performance differently

Coating Type IR Impact
AR (Anti-Reflection) Improves IR transmittance
AG (Anti-Glare) May scatter and reduce IR
AF (Anti-Fingerprint) Minimal effect
IR-blocking film Blocks infrared transmission


Selecting the optimal cover glass is a strategic decision that extends beyond durability and cost. For devices featuring facial recognition, proximity sensing, or optical touch, the cover glass serves as the critical optical gatekeeper. The data presented confirms that by prioritizing high-transmittance materials—such as low-iron or aluminosilicate glass—and minimizing thickness, engineers can effectively future-proof their designs. This approach ensures robust sensor performance, unlocks new user experiences, and maintains a competitive edge in an increasingly sensor-driven market.

Should you have any questions about privacy film, please consult our engineering.

author-avatar

About Lily Liang

Account Manager - Orient Display

Displays

Privacy Film Knowledge

Types of Privacy Films

Type Principle Features Typical Applications
Micro-Louver Type Uses micro-louver structures to restrict the light emission angle (e.g., ±30° or ±45°) Mainstream type; clear front view, darkens when viewed from the side Smartphones, laptops, ATMs, car displays, industrial monitors
Polarization Type Uses a polarizer to restrict the light vibration direction Higher cost, slightly lower transmittance; suitable for high-contrast displays High-end industrial displays, medical devices
Diffusion Type Scatters light with micro-particles to reduce side visibility Low cost, modest privacy effect, significant brightness reduction Price-sensitive products
Hybrid Type Combines micro-louver with polarizer or anti-reflection Offers multiple functions: privacy, anti-glare, anti-fingerprint High-end laptops, tablets, car infotainment screens


Currently, we mainly use micro-louver type privacy films. The following structure diagrams illustrate the principle:

The micro-louver layer resembles tiny blinds (spacing only tens of microns) that allow light to pass in a specific direction (vertical or ±30°).

  • Front view: Light passes directly → screen content is clear
  • Side view: Light blocked by louvers → screen darkens or becomes invisible

Typical privacy angles:

  • Horizontal: 30°, 45°, 60°
  • Vertical: Up/down privacy is also possible (used for laptops, ATMs, etc.)

From the third structural diagram (this is an automotive light-controlled privacy film), we can see that there are AG layers on both the top and bottom of the privacy film. This type of structure is commonly referred to as a Double-sided AG Privacy Film.

Features:

  • Double-sided anti-glare (AG): Reduces reflections on both surfaces, improves display visibility, scratch-resistant
  • Privacy protection: Darkens at side angles to prevent viewing by others
  • Surface feel: Fine matte AG texture, good anti-fingerprint performance
  • Applications: Outdoor high-brightness TFT LCDs, car displays, industrial monitors, laptops


Structure of Privacy Film

Privacy films are multi-layer composites. Key layers include the base layer, micro-louver layer, OCA, plus optional layers like hard coating and adhesive layers.

  1. Hard Coating Layer: Scratch-resistant, increases surface hardness (typically 3H–9H)
  2. Base PET Layer: Provides mechanical strength and stability
  3. Micro-Louver Layer: Core privacy structure controlling light direction
  4. Optical Adhesive (OCA): Bonds layers while maintaining optical clarity
  5. Adhesive/Silicone Layer: Allows attachment to the screen surface, can be removed and reapplied without residue


Installation Methods

  • Surface-mounted: Uses silicone or OCA; easy to apply, removable; reduces surface hardness
  • Embedded: Laminated inside the LCD module; higher protection, does not affect surface hardness
  • Magnetic/Clip-on: External, detachable; often used for monitors

In our industry, the simplest approach is to attach the privacy film directly to the display surface:

  • Pros: easy, low cost
  • Cons: reduces surface hardness
    Another method is to insert the film between the backlight and LCD glass:
  • Pros: preserves surface hardness
  • Cons: adds to assembly complexity


Key Parameters of Privacy Film

Privacy film parameters fall into four categories: optical, physical structure, environmental/ durability, and surface functions.

  1. Optical Parameters:

  • Visible Light Transmittance (VLT): Ratio of visible light passing through; higher value → brighter screen.
    • Typical range: 50%–85%
  • Viewing Angle / Privacy Angle: Screen is clear at center, darkens beyond this angle.
    • Typical range: ±30°, ±45°, ±60°
  • Haze: Degree of light scattering; higher haze reduces glare but slightly lowers clarity.
    • Typical range: 2%–15% (AG surface)
  • Reflectance: Surface reflection rate; affects anti-glare performance.
    • Typical range: 1%–10%
  • Polarizer Compatibility: Must match TFT LCD polarizer to avoid distortion or color shift
    • Typical range: To Be Verified by Testing

Optical parameters are our main focus. The following are the specifications for the double-sided anti-glare privacy film:

  • Total Light Transmittance: ~70%–80% (high-transmittance privacy film); e.g., a 1000 nits display may drop to 700 nits
  • Transmittance: 70%–80% indicates a high-transmittance privacy film.
  • Haze: 10%–40% clearly shows that the surface has been treated with AG (anti-glare) coating.
  • Up/down (Vertical Viewing Angle) 30° transmittance ≤15%:
    • Up/down 30° angle (±30°): Refers to the viewing angle 30° above or below the vertical center of the screen (vertical privacy direction).

At this angle, visible light passing through the privacy film is less than 15% of the front brightness.

This indicates that the film provides vertical (up/down) privacy protection.

  • Transmittance <15%: At this angle, the intensity of visible light passing through the privacy film is less than 15% of the front-facing brightness.

This means that the privacy film provides vertical (up/down) privacy protection.

Item Unit Typical Value Testing Standard
Thickness of Functional Layers µm 370±20 GB/T 33399
Total Light Transmittance % ≥70 GB/T 2410
Haze º 10~40 GB/T 2410
Transmittance at 30°

Vertical Viewing Angle

% ≤15 /


PS: The table below shows the characteristics of privacy films with different Transmittance levels. This is also helpful for our selection process.

Type Transmittance (Approx. Range) Features
Standard HD Film 90%–95% Clear display, minimal brightness loss
Privacy Film (Standard) 50%–70% Noticeable viewing angle limitation, screen slightly darkened
High-Transmittance Privacy Film 70%–80% Maintains privacy while minimizing brightness loss
Strong Privacy Film 40%–55% Strong privacy effect, but darker screen and deeper colors


  1. Physical / Mechanical Parameters

  • Total Thickness: Overall thickness including PET substrate, AG layer, privacy layer, etc.
    Typical range: 0.1–0.5 mm
  • Base Material: PET, PC, PMMA, Glass Composite, etc.
    Typical range: Depends on application
  • Surface Hardness: Scratch resistance, usually expressed in pencil hardness (H)
    Typical range: 3H–9H
  • AG Layer Roughness (Ra): Affects haze, feel, and anti-reflection performance
    Typical range: 0.02–0.1μm
  • Adhesive Type: Silicone, OCA, or adhesive-free electrostatic


  1. Durability / Environmental Tests

  • Operating / Storage Temperature Range: Typically -20℃ to +80℃
  • Humidity Resistance: No bubbling or discoloration after 60℃ / 90% RH test
  • UV Resistance: No yellowing after prolonged exposure
  • Adhesion Strength: Strength of adhesive bonding to the screen


  1. Surface Treatments / Functionalities

  • Anti-Glare (AG): Reduces reflection, improves outdoor readability
  • Anti-Fingerprint (AF): Oleophobic/hydrophobic, easy to clean
  • Anti-Scratch: Enhances wear resistance
  • Anti-Reflection (AR): Improves optical contrast
  • Anti-Static: Prevents dust attraction


The table below shows how to evaluate or select different types of privacy films based on their parameters.

Dimension Micro-Louver Polarization Diffusion Hybrid
Viewing Angle Clearly specified ±30° / ±45° Smooth decay curve Not specified, only “blurred” Both ± angles + polarizer transmittance data
Transmittance (Tt) 60–75% (relatively high) 35–50% 50–70%, haze > 60% 40–60% (depends on structure)
Haze 10–25% 20–40% 60–90% 30–60%
Contrast Retention ≥90% (front view) ~80% <70% 70–90%
Thickness / Layers 0.25–0.4 mm, double or triple layer ~0.2 mm, with polarizer <0.2 mm, single or double layer >0.4 mm, multi-layer stack
Microstructure Feature Visible parallel micro-groove array No micro-grooves, anisotropic film Rough matte Micro-grooves + polarizer layers

Should you have any questions about privacy film, please consult our engineering.

author-avatar

About Veronica Chen

Technical Support - Orient Display

Displays

Understanding LCD Refresh Rate and Its Engineering Significance

The refresh rate of a Liquid Crystal Display (LCD) is a critical specification that reflects the number of times the display updates its image per second, typically measured in hertz (Hz). It plays a vital role in determining motion smoothness, response to fast-moving visuals, and synchronization with input signals. Understanding how refresh rate interacts with driving circuits, frame memory, and liquid crystal response characteristics is essential for optimizing both performance and power efficiency.

Let’s explores:

  • Real example calculation comparing 16-bit vs 24-bit RGB for a 7.0″ 1024×600 TFT panel
  • Key Parameters That Affect LCD Refresh Rate
  • How it continues to evolve with display technology.

Refresh rate means how many times per second the LCD updates the image on the screen.
It is measured in hertz (Hz) — for example:

  • 60 Hz → the display refreshes 60 times per second
  • 120 Hz → 120 times per second

Even though the image may not always visibly change, the panel still refreshes its pixels at that rate. A higher refresh rate usually gives smoother motion and less flicker.

Key Parameters That Affect LCD Refresh Rate

  1. Interface Bandwidth / Pixel Clock (DCLK or DOTCLK)
    • This is the most important factor.
    • The pixel clock defines how fast pixel data are transmitted from the driver (MCU, GPU, or controller) to the LCD module.
    • Formula (approx.):

Where

Example:
let’s go step by step with a 7.0″ TFT display (1024 × 600 resolution) and compare 16-bit RGB vs 24-bit RGB interface.

Step A. Basic Display Parameters

Item Symbol Typical Value
Active pixels (horizontal) H_active 1024
Active pixels (vertical) V_active 600
Horizontal blanking (porch + sync) H_blank 32
Vertical blanking (porch + sync) V_blank 23
Total horizontal pixels H_total 1024 + 32 = 1056
Total vertical pixels V_total 600 + 23 = 623

So total pixels per frame:

A 1024×600 TFT with a 40 MHz pixel clock →

Step B. Set Target Refresh Rate (e.g., 60 Hz)

We want:

Then pixel clock must be:

Conclusion:  Roughly a 40 MHz dot clock is needed for 60 Hz refresh.

Step C. Calculate Data Bandwidth

Case A: 16-bit RGB (RGB565)

Each pixel = 16 bits = 2 bytes

79 MB/s

Case B: 24-bit RGB (RGB888)

Each pixel = 24 bits = 3 bytes

118 MB/s

Step D. Compare

Parameter 16-bit RGB 24-bit RGB Difference
Bits per pixel 16 24 +50%
Bandwidth needed 632 Mbps 948 Mbps +50%
*Refresh rate (if pixel clock fixed at 40 MHz) 60 Hz ~40 Hz ↓ 33%
Color quality 65 K colors 16.7 M colors ↑ massively

*At any fixed interface bandwidth, 24-bit needs 50% more bandwidth than 16-bit, so its achievable refresh rate is 2/3 of 16-bit’s (if everything else is equal).

Step E. Critical Thinking:

  • The refresh rate is limited by the pixel clock (DCLK).
  • If your LCD controller has a fixed bandwidth, using 24-bit RGB means you must lower the refresh rate or use a faster clock / better interface (e.g. LVDS, MIPI-DSI).
  • For small embedded systems, 16-bit RGB is often chosen because it maintains 60 Hz refresh without needing a high-speed interface.


  1. Resolution (number of pixels)
    • Higher resolution = more pixels to refresh → requires a higher pixel clock to keep the same frame rate.
    • For example, 800×480 needs less bandwidth than 1920×1080 for the same refresh rate.
  2. Color Depth (Bits per Pixel)
    • 24-bit RGB (8 bits per color) transfers 50% more data than 16-bit RGB, so it may limit maximum refresh rate if bandwidth is fixed.
  3. Interface Type
    • Parallel RGB (DOTCLK) — refresh rate directly tied to pixel clock.
    • LVDS, eDP, MIPI-DSI — higher data rate interfaces that allow higher refresh rates.
    • SPI/MCU Interface — limited bandwidth, usually for lower resolution displays.
  4. Panel Response Time
    • Response time is how fast the liquid crystal changes state (in milliseconds).
    • Even if the refresh rate is high, slow response time can cause motion blur.


Parameter Impact on Refresh Rate Notes
Pixel Clock (DCLK)  Directly determines refresh rate Higher clock = faster refresh
Resolution Inversely proportional More pixels = lower refresh if clock fixed
Color Depth Affects data throughput Higher bit depth = slower if bandwidth limited
Interface Type Sets max possible rate SPI ≪ RGB ≪ LVDS/MIPI
Response Time Doesn’t change refresh rate but affects motion clarity Measured in ms


The relationship between refresh rate and refresh time is inversely proportional. As the refresh rate increases, the duration of each frame period decreases, allowing images to be updated more frequently. Table 1 below illustrates this relationship for several common refresh rate values used in LCD panels.

Table 1. Relationship Between Refresh Rate and Frame Refresh Time

Refresh Rate (Hz) Frame Time (milliseconds) Explanation
30 Hz 33.33 ms Each image is displayed for one-thirtieth of a second; suitable for static or low-motion displays.
60 Hz 16.67 ms Standard rate for most consumer LCDs; offers good balance between smoothness and power efficiency.
90 Hz 11.11 ms Provides noticeably smoother motion; used in high-end smartphones and VR headsets.
120 Hz 8.33 ms Common for gaming and automotive displays requiring fast motion response.
240 Hz 4.17 ms Enables extremely fluid motion; mainly used in professional gaming monitors and advanced prototypes.


From a performance standpoint, higher refresh rates improve motion fluidity and reduce flicker, resulting in a more stable and comfortable viewing experience. Applications such as gaming, augmented reality, and high-speed instrumentation often benefit from 120 Hz or higher operation. Conversely, static or semi-static displays operate efficiently at lower frequencies, balancing performance with energy savings. Adaptive and variable refresh rate technologies now dynamically adjust the frequency according to displayed content, achieving both visual stability and power optimization.

In summary, the refresh rate embodies a complex interaction between optical materials, electronic architecture, and perceptual quality. Through precise control of refresh timing and signal management, LCD technology continues to evolve toward faster, more power efficient, and more adaptive display performance.


Should you have any questions about LCD’s refresh rate, please consult our engineering.

author-avatar

About Lily Liang

Sales Manager - Orient Display

Displays

3M VHB Introduction

What it is VHB?

  • “VHB” stands for Very High Bond. The tape family is a line of double-sided acrylic-foam adhesive tapes that are designed to permanently bond parts without mechanical fasteners.
  • The 5952 version (as an example) has a 0.045 in (≈1.1 mm) thick black foam core with modified acrylic adhesive on both sides.
  • The foam core is “viscoelastic” — meaning it has both viscous (flows to fill gaps) and elastic (resists deformation) properties.
  • The tape is marketed as able to replace rivets, screws, welds, and liquid adhesives in many applications.

Key Features & Benefits

  • Strong bond + structural load capability: Because the adhesive flows into microscopic irregularities and the foam distributes load, you get both peel and shear strength.
  • Weather / environment resistance: The VHB tapes are designed for outdoor use, with resistance to UV, moisture, solvents, temperature cycling.
  • Flexibility / conformability: The viscoelastic foam helps accommodate differences in thermal expansion, slight mismatches in surface, and vibration.
  • Aesthetics & clean finish: Because you avoid visible screws, rivets, or welds, you can get smoother surfaces and cleaner appearance.
  • Simplified assembly: Compared to drilling, welding, screwing, etc., tape is faster and cleaner (no debris, no need to finish welds).

Typical Use-Cases / Applications

  • Construction & Architecture: Bonding exterior panels, metal to metal, glass to metal, etc. The tape distributes load across the full bond area rather than concentrating at fasteners.
  • Transportation: Automotive, trains, buses — where you might want to eliminate rivets or welds for weight savings, smoother surfaces, quieter ride (less vibration).
  • Appliances & Electronics: For joining dissimilar materials (metal, glass, plastics) where aesthetics and sealed bond is important.
  • Signage / Displays: Attaching signs, panels, trim where mechanical fasteners might be unsightly or impractical.

Selecting the Right Tape & Practical Considerations

  • Surface Energy / Material compatibility: Some versions are optimized for high and medium surface energy substrates (metals, glass, rigid plastics). Others target low surface energy plastics. For example, one guide says the “49” family is broad-range, “59” family for powder-coated plastics.
  • Surface Preparation: Critical for good bond. Cleaning, possibly abrasion or priming may be required, especially for plastics or low surface energy materials.
  • Pressure & dwell: After application you should apply firm pressure to get good contact of the foam to surface. Some load-bearing capacity builds over time as the adhesive flows.
  • Temperature limits: For example, 5952 allows short-term use up to ~300 °F (≈149 °C) and long-term up to ~200 °F (≈93 °C) on certain surfaces.
  • Thickness and tolerances: Foam thickness matters (gap-filling ability, bond line). For 5952 the thickness is ~1.1 mm ±10%.
  • Mechanical loads & environment: Though the tape is very strong, design should account for the loads (peel is always the worst for adhesives), possible expansion/contraction, vibration fatigue. The viscoelastic nature helps but you still need good engineering.
  • Removal / permanence: These tapes are intended to be permanent. Removal is difficult without damage to substrate.
  • Cost vs traditional fasteners: Tape may have higher material cost, but installation savings and appearance may offset. Also weight savings for transport applications.

Comparison Chart: Key Families

Family Key Features Typical Use-Cases Example Tape
4941 / 49xx Family General-purpose acrylic foam core; good adhesion to high & medium surface energy substrates (metals, glass, many plastics) with good conformability. Bonding panels, nameplates, trim, sign mounting on common substrates. 3M VHB Tape 4941
5952 / 59xx Family Modified acrylic adhesive + very conformable foam core; broader substrate range including powder-coated paints & many plastics. More challenging surfaces (paint, powder coat, some plastics), bonding dissimilar materials. 3M VHB Tape 5952
RP+ Family Premium version for high strength, large panels, dissimilar materials; good for structural bonding. Structural assemblies, large metal panels, where fasteners would normally be used. 3M VHB Tape RP+ 160GF
Clear / Thin Bond / Specialty Families Variants for aesthetic or specialized requirements: e.g., clear adhesive for glass/transparent parts; thin bond for minimal gap; flame-retardant, low VOC, LSE (low surface energy) plastics. Transparent assemblies, very thin or flush bond lines, bonding plastics with very low surface energy, electronics. Examples: 3M VHB Tape 4910 (clear); 3M VHB Tape 5906 (thin bond)


Example Product Variants

Here are some sample variants with different spec and intended uses:

  • 3M VHB Tape 5952: A common black-foam variant for many painted and powder-coated metals, good all-round.
  • 3M VHB Tape 4910 Clear: Clear version – for aesthetic applications where black foam not acceptable.
  • 3M VHB Tape 4611 High‑Temp: Higher temperature capability, suited for pre-paint bonding (metal assemblies).
  • 3M VHB Tape RP+ 160GF: Specialized for dissimilar surfaces and high temperature (e.g., up to ~450 °F short-term).
  • 3M VHB Tape 5958FR Flame Retardant: Flame-retardant version for building codes / electrical enclosures.
  • 3M VHB Tape 4941 General Purpose: General purpose version for many medium-duty applications.
  • 3M VHB Tape 4959 Heavy Duty: For heavier structural bonding, e.g., aluminum skin to steel frames in transportation.
  • 3M VHB Tape 5906 Thin‑Bond: Designed for thin bond lines – when you want minimal thickness between joined parts.

Limitations & Things to Watch

  • While tape is very strong, design still needs to account for peel stresses, differential expansion, and fatigue/vibration. Just sticking things together without considering loads can lead to failure.
  • Surface preparation is vital. Contaminants, insufficient priming, or low surface energy plastics can reduce bond strength significantly.
  • Temperature extremes: Although many versions resist high temps, extreme heat or cold beyond spec will degrade adhesive performance.
  • Bond line thickness: Too thick or too thin a gap may degrade performance. The foam core is chosen partly to compensate for irregular surfaces, but there are limits.
  • Disassembly or repair: If you need to remove or service bonded parts frequently, mechanical fasteners might still be better.
  • Cost & supply: Some VHB variants cost significantly more than standard tapes or mechanical fasteners. For large area bonding, cost-benefit must be considered.

How to decide which family/version to use

Here are some decision factors (especially relevant given your hardware systems work) and what to check:

  • Substrate Materials & Surface Energy
    • High/medium surface energy (HSE/MSE) materials like aluminum, steel, glass, many painted plastics → general-purpose tapes (e.g., 4941 family) often suffice.
    • Low surface energy (LSE) plastics, oily surfaces, powder-coated paints, “hard-to-stick” plastics → go for more specialized (59xx family, LSE versions)
    • If bonding dissimilar materials (e.g., metal to plastic), you might want the higher strength/conformability of RP+ or 59xx families.
  • Gap / Surface Irregularity / Thickness
    • If surfaces are perfectly flat and well matched, a thinner core (e.g., 0.4 mm) may work.
    • If surfaces are irregular or have mismatches (texture, gaps), a thicker or more conformable foam helps (e.g., 1.1 mm typical for many)
    • For very thin bond line requirements (minimal thickness between parts) the “thin bond” specialty versions are an option.
  • Mechanical / Environmental Loads
    • Consider shear vs peel forces: adhesive tapes handle shear (parallel to surface) much better than peeling (perpendicular) so design joint accordingly. The design guide explains this.
    • Temperature: If your bonded assembly sees high bake-cycles, ovens, high ambient temperatures, choose a tape rated for higher temperature (e.g., RP+ or specialty high-temp families)
    • Outdoor, UV, moisture, vibration: All VHB tapes have good durability, but the higher spec versions give more margin.
  • Aesthetics / Hidden Fasteners
    • If you want clean visible surfaces (no screws/rivets) then tape is excellent.
    • If the bond line must be invisible or clear (glass to glass, transparent plastics), use a clear version (4910 family or similar).
  • Serviceability / Future Removal
    • Adhesive tapes are intended as permanent bonds; if you expect to disassemble frequently, you may want mechanical fasteners or hybrid (tape + fastener) approach.
  • Surface Preparation & Application
    • Clean surfaces well (remove grease, oxide, contamination). Some surfaces may need abrasion or priming.
    • Apply sufficient pressure during bonding to ensure full contact. Some dwell time may be required to reach full strength.


Should you have any questions about VHB, please consult our engineering.

Displays

Overview of Methods for Driving LED Backlight

1. Operating Principle of LEDs

Before designing a driver circuit, it is important to understand how an LED operates. The brightness of an LED is primarily determined by its forward voltage (VF) and forward current (IF). The current–voltage characteristic curve is shown in Figure 1. Here, VF represents the forward voltage drop, while IF is the forward current.

Once the applied forward voltage exceeds the threshold level (also known as the turn-on voltage, approximately 1.7 V in this case), IF can be considered nearly proportional to VF. As illustrated in the figure, the maximum forward current of an LED can reach up to 1 A, while the typical forward voltage range is about 2 V to 4 V.


Figure 1. Relationship between VF and IF

The forward voltage drop of an LED can vary over a relatively wide range (more than 1 V). From the VF–IF curve shown above, it is clear that even a small change in VF can cause a large variation in IF, which in turn leads to significant fluctuations in brightness. For this reason, the luminous characteristics of LEDs are generally described as a function of current rather than voltage.

However, in typical rectifier circuits, the output voltage fluctuates with changes in the mains supply voltage. This means that using a constant-voltage source cannot ensure consistent LED brightness and may negatively affect LED performance. Therefore, LED drivers are usually designed to operate as constant-current sources.

2. LED Driving Techniques

From the operating principle of LEDs, it is clear that to maintain optimal brightness, an LED must be driven by a constant-current source. The driver’s role is not only to ensure this constant-current characteristic but also to achieve low power consumption.

To meet these requirements, the commonly used methods of current control include:

  • Adjusting the value of a current-limiting resistor to regulate the current.
  • Varying the reference voltage across the current-limiting resistor to control the current.
  • Using PWM (Pulse Width Modulation) to achieve current regulation.

The techniques employed in LED drivers are very similar to those used in switch-mode power supplies. In essence, an LED driver is a type of power conversion circuit, but its output is a constant current rather than a constant voltage. Under all conditions, the circuit must deliver a stable, average current, with ripple current kept within a specified range.

(1) Current-Limiting Method
Figure 2 shows the simplest circuit that uses the current-limiting method.


Figure 2. Simplest Circuit of the Current-Limiting Method

As shown in Figure 3, this is the traditional circuit configuration. The mains voltage is stepped down, rectified, and filtered, then a series resistor is used for current limiting to keep the LED operating stably and to provide basic protection.

However, the fatal drawback of this approach is that the power dissipated in the resistor R directly reduces system efficiency. Combined with transformer losses, the overall system efficiency is only about 50%. Moreover, when the supply voltage fluctuates within ±10%, the current through the LED can vary by 25% or more, and the power delivered to the LED may change by over 30%.

The main advantage of resistor current limiting is its simplicity, low cost, and lack of electromagnetic interference (EMI). Nevertheless, its disadvantages are significant: the LED brightness changes with variations in VF, the efficiency is very low, and heat dissipation becomes a serious issue.

Figure 3. Traditional Resistor Current-Limiting Circuit

There is also a straightforward article online about the current-limiting method that can be referenced: https://www.ourpcb.com/current-limiting-resistor.html

For more information on constant-current LED backlight driving, see: https://orientdisplay.com/wp-content/uploads/2018/07/OrientDisplay-Backlight-Constant-Current-Driver.pdf

(2) Voltage Regulation Method
As shown in Figure 4, this circuit is based on Figure 3, with the addition of an integrated voltage regulator (MC7809). This keeps the output voltage essentially stable at 9 V, allowing the current-limiting resistor R to be made very small, which prevents voltage instability across the LED.

However, the efficiency of this circuit remains low. Since the voltage drop across both the MC7809 and resistor R1 is still significant, the overall efficiency is only about 40%. To achieve both stable LED operation and higher efficiency, low-power current-limiting components and circuits should be used to improve system performance.

The linear voltage regulation method has the advantages of simple structure, few external components, medium efficiency, and relatively low cost.

Figure 4 Voltage Regulation Method

(3) PWM Method
PWM (Pulse Width Modulation) controls LED brightness by adjusting the duty cycle of the driving current pulses. This dimming technique repeatedly switches the LED driver on and off using simple digital pulses. By supplying digital pulses of varying width, the output current can be modulated, thereby changing the brightness of a white LED.

The distinctive feature of this driving circuit is that energy is transferred to the load through an inductor. Typically, a PWM control signal is used to switch a MOSFET transistor on and off. By varying the duty cycle of the PWM signal and the charging/discharging time of the inductor, the ratio between input and output voltage can be regulated.

Common circuit topologies of this type include buck, boost, and buck–boost converters. The advantages of the PWM method are high efficiency and stable performance, but its drawbacks include audible noise, higher cost, and more complex design.

Figure 5. LED Driving Circuit Using PWM Method

As shown in Figure 5, the PWM signal is connected through the base of transistor VQ1 to the gate of a P-channel MOSFET. The gate of the P-channel MOSFET is driven by a simple NPN transistor amplification circuit, which improves the MOSFET’s conduction process and reduces the power consumed by the driver circuit.

If the MOSFET is driven directly by the circuit, the rapid switching on and off of the MOSFET can cause oscillations in the drain–source voltage. This may lead to radio frequency interference (RFI) and, in some cases, expose the MOSFET to excessively high voltages, resulting in breakdown and damage.

To address this problem, a non-inductive resistor is inserted in series between the gate of the driven MOSFET and the driver circuit output. When the PWM signal is at a high level, transistor VQ1 conducts, pulling the MOSFET gate voltage below the source voltage. As a result, the MOSFET turns on, and the LED lights up. Conversely, when the PWM signal is at a low level, VQ1 is cut off, the MOSFET turns off, and the LED is extinguished.

3. LED Driver IC Solutions

LED backlight driver ICs are primarily used in LCD displays (televisions, laptops, mobile phones, automotive screens, etc.) to provide a constant current or constant voltage to the LED modules. Their purpose is to ensure uniform brightness, high efficiency, and long lifetime. Common driver topologies include boost (step-up), buck (step-down), buck–boost, and multi-channel constant-current drivers. Below are several representative categories of LED backlight driver ICs:

(1). Texas Instruments (TI)

  • TPS61169: Single-channel boost constant-current driver, suitable for small-size LCDs (e.g., mobile phones).
  • LP8556: Supports I²C control, multi-channel output (up to 6 channels), and both PWM/analog dimming. Widely used in laptops and automotive displays.

(2). ON Semiconductor (now onsemi)

  • NCP3170 / NCP3170B: High-efficiency buck drivers, suited for small- to medium-size screens.
  • NCV7685: 16-channel constant-current driver, often used in automotive backlighting and dashboards, featuring high reliability and diagnostic functions.

(3). STMicroelectronics (ST)

  • STLED524: Multi-channel LED backlight driver with I²C interface.
  • L5973D: Boost DC-DC converter for medium-power LED backlight systems.

(4). Renesas Electronics

  • ISL98611: Integrates boost and positive/negative charge pump outputs, designed for smartphone power and backlight driving.
  • ISL97900: Multi-channel LED backlight driver with high-precision current matching.

(5). China Manufacturers

  • Macroblock (MBI series): e.g., MBI5030, focused on large-display and backlight drivers, widely used in TVs and advertising panels.
  • Solomon Systech: Has released LED backlight driver solutions for mobile phones and small-to-medium displays.
  1. Summary
  • Small-size screens (phones, tablets): TI TPS/LP series, Renesas ISL series.
  • Medium-to-large screens (laptops, monitors, TVs): Multi-channel constant-current drivers such as TI LP8556, ST STLED524, Macroblock MBI series.
  • Automotive and industrial applications: Require reliability and multi-channel control, typically using onsemi NCV series.

4. Comparison Table of LED Backlight Driver ICs

Manufacturer Model Channels Driving Method Control Interface Typical Applications
TI (Texas Instruments) TPS61169 Single-channel Boost constant-current PWM / Analog Mobile phones, small displays
TI LP8556 6 channels Multi-channel constant-current with boost I²C + PWM Laptops, automotive displays
onsemi (formerly ON Semiconductor) NCP3170 Single-channel Buck constant-current PWM Small- to medium-size screens
onsemi NCV7685 16 channels Constant-current SPI / I²C Automotive backlight, dashboards
ST (STMicroelectronics) STLED524 6 channels Multi-channel constant-current I²C Monitors, televisions
ST L5973D Single-channel Boost DC-DC constant-current PWM / Analog Medium-power backlight
Renesas ISL98611 3 channels + power outputs Boost + charge pump I²C Smartphones, tablets
Renesas ISL97900 Multi-channel Constant-current I²C Laptops, tablets
Macroblock (明微电子) MBI5030 16 channels Constant-current SPI TVs, large advertising displays
Solomon Systech (晶门科技) SSD series (e.g., SSD2805) 6–8 channels Multi-channel constant-current I²C Mobile phones, small-to-medium displays

5. Key Parameter Comparison of LED Backlight Driver ICs

Manufacturer Model Input Voltage Range Output Channels Max Current (per channel) Efficiency Package Typical Applications
TI TPS61169 2.7–18 V 1 1.2 A ~90% SOT-23 Mobile phones, small displays
TI LP8556 2.7–5.5 V 6 30 mA ~90% WQFN Laptops, automotive displays
onsemi NCP3170 4.5–18 V 1 3 A ~90% SOIC-8 Small- to medium-size screens
onsemi NCV7685 6–40 V 16 75 mA ~85% TSSOP Automotive backlight, dashboards
ST STLED524 2.7–5.5 V 6 30 mA ~85–90% QFN Laptops, monitors
ST L5973D 4–36 V 1 2 A ~90% HSOP-8 Industrial / medium-power backlight
Renesas ISL98611 2.5–5.5 V 3 + power rails 30 mA ~90% WLCSP Smartphones, tablets
Renesas ISL97900 2.5–5.5 V 6 25 mA ~90% QFN Laptops, tablets
Macroblock MBI5030 3–5.5 V 16 80 mA ~85% SSOP/QFN Large TVs, advertising panels
Solomon Systech SSD2805 2.7–5.5 V 6–8 25 mA ~85% QFN Mobile phones, small-to-medium displays


Key Comparison Points

1.      Number of Channels

o   Small screens → Single-channel (e.g., TPS61169)

o   Medium screens / Automotive → 6-channel (e.g., LP8556, STLED524)

o   Large screens / Televisions → 16 channels or more (e.g., NCV7685, MBI5030)

2.      Driving Method

o   Boost (step-up) → Common in smartphones and tablets, used to raise low supply voltages to higher levels for driving multiple LEDs in series.

o   Buck (step-down) → Better suited for high-voltage power sources driving fewer LEDs.

o   Multi-channel constant-current → Ensures brightness uniformity, ideal for large-screen backlighting.

3.      Control Interface

o   PWM → Simple, widely used in mobile devices.

o   I²C → More flexible, allows adjustable current, voltage, and dimming curves.

o   SPI → High-speed and multi-channel, well-suited for TVs and advertising displays.


6. Recommended Application Scenarios for LED Backlight Driver ICs

  • Small-size screens (smartphones / tablets) → Single-channel boost drivers, e.g., TI TPS61169, Renesas ISL98611
  • Medium-size screens (laptops / automotive displays) → 6-channel multi-channel constant-current drivers, e.g., TI LP8556, ST STLED524, Renesas ISL97900
  • Large-size screens (monitors / TVs) → 16-channel or higher constant-current drivers, e.g., Macroblock MBI5030
  • Special scenarios (automotive / advertising displays) → High-reliability multi-channel drivers, e.g., onsemi NCV7685, Macroblock MBI series
author-avatar

About Veronica Chen

Technical Support - Orient Display